Dashboard
The dashboard is where the portal opens. It answers one question: what is happening today?
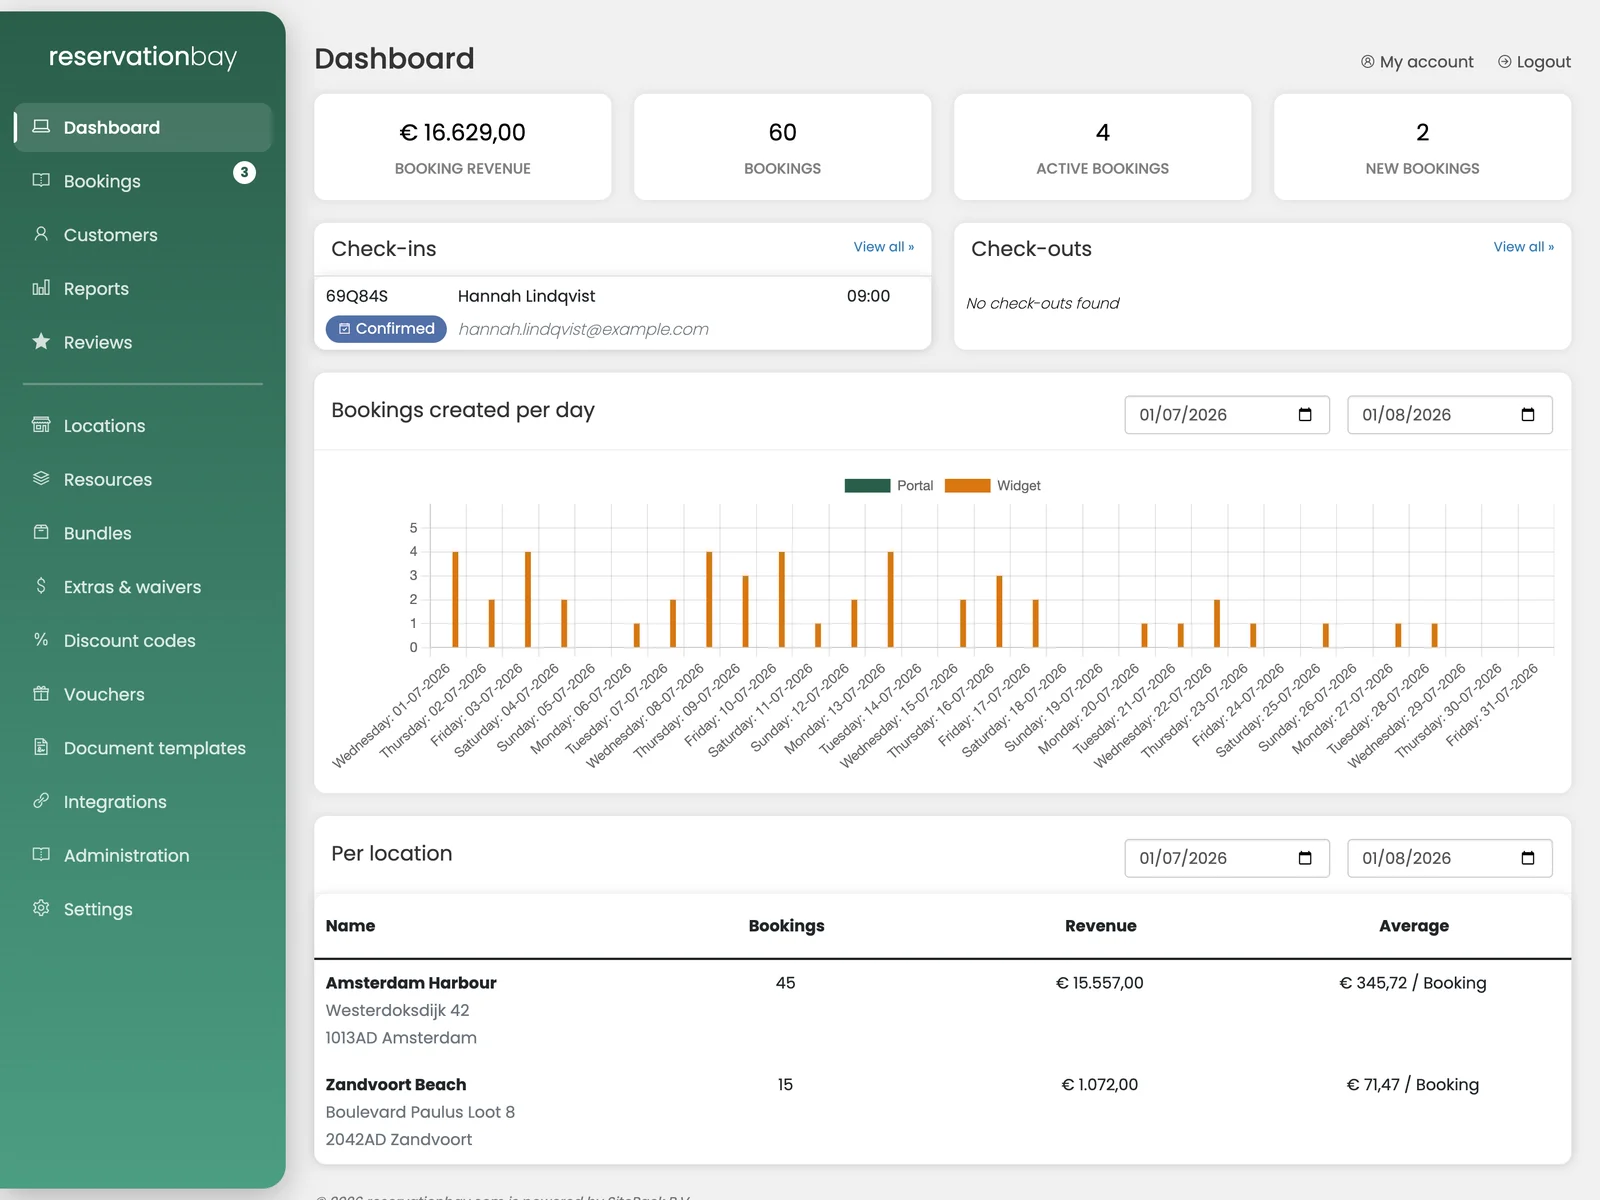
The four counters
Across the top:
- Booking revenue: what your bookings are worth.
- Bookings: how many there are.
- Active bookings: rentals that are currently out.
- New bookings: entered but not yet confirmed by you. This is the number that also appears as a badge next to Bookings in the menu.
Check-ins and check-outs
Two lists side by side, showing the bookings due today.
Check-ins are the customers coming to collect; check-outs are the objects coming back. Each row shows the booking reference with its status badge, the customer's name and email, and the time.
Click any row to open the booking. View all » takes you to the full check-in or check-out screen.
If a list is empty, it says so. That is not an error. It just means nothing is due.
Charts
Bookings created per day: a bar chart of how many bookings came in each day, so you can see your weekly rhythm and whether a campaign moved anything.
Per location: a table of each location with its revenue, its average booking value and its number of bookings. Useful when you run more than one shop and want to know which one is carrying the month.
Looking at one location
The dashboard can be narrowed to a single location. From the Locations screen, open a location's details and you get the same counters for that location alone.
Where the deeper analysis lives
The dashboard is deliberately shallow. It is a glance, not an analysis. Occupancy, revenue per category, where your bookings came from, what a discount campaign returned, and this year against last year all live on the Reports page.